What Is Conversion Rate Optimization? The Complete CRO Guide for 2026
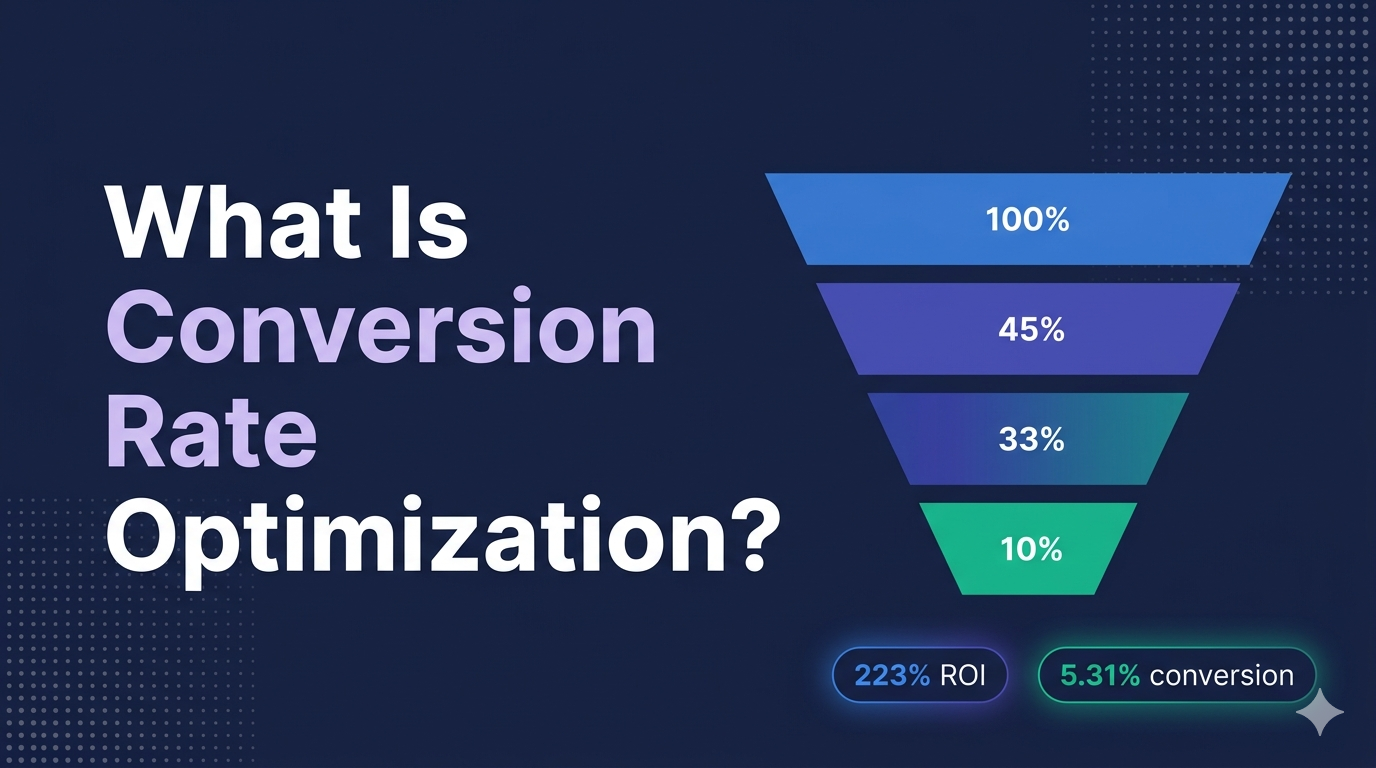
CRO turns existing traffic into revenue: companies using CRO tools average 223% ROI, yet only 39.6% have a documented strategy. Here's how to close that gap.
What Is Conversion Rate Optimization? The Complete CRO Guide for 2026
The average website converts just 2.9% of its visitors. That means for every 100 people who land on your page, 97 leave without doing what you wanted them to do — buy, sign up, download, or call. Most marketers respond by spending more on ads to drive more traffic. CRO practitioners flip that logic: they squeeze more conversions from the traffic they already have.
Conversion rate optimization (CRO) is the systematic process of increasing the percentage of website visitors who take a desired action. It combines behavioral data, psychology, and controlled experimentation to remove friction, build trust, and guide users toward a goal. Done right, it's one of the highest-ROI investments in digital marketing — companies using dedicated CRO tools report an average ROI of 223% (SQ Magazine, 2025).
In this guide, you'll learn exactly what CRO is, how to calculate and benchmark your conversion rate, the six core pillars of an optimization program, and the testing frameworks that separate disciplined growth teams from guesswork marketers. Whether you're building your first CRO strategy or auditing an existing program, this is your starting point.
Key Takeaways
The global average conversion rate across industries is ~2.9%, but the top 25% of landing pages convert at 5.31% or higher (SQ Magazine, 2025).
Companies using CRO tools average 223% ROI, yet only 39.6% have a formally documented strategy.
Page speed, A/B testing, social proof, and mobile UX are the highest-leverage CRO levers available right now.
Sites loading in one second convert at approximately 3× the rate of five-second sites (Landbase, 2026).
What Exactly Is a "Conversion" — and How Do You Calculate Your Rate?
A conversion is any action a visitor takes that moves them closer to your business goal. That definition is intentionally broad because what counts as a conversion varies by business model.
Macro conversions are primary goals that directly generate revenue: a completed purchase, a submitted sales inquiry, a booked appointment. Micro conversions are supporting steps — a newsletter signup, a product video view, a pricing page visit — that indicate engagement and predict future macro conversions.
Tracking both matters. A B2B SaaS company might count a demo request as its macro conversion, but whitepaper downloads and pricing page visits are micro conversions that reveal intent earlier in the funnel.
The formula itself is simple:
Conversion Rate (%) = (Conversions ÷ Total Visitors) × 100
If 2,000 people visit your landing page and 58 submit the lead form, your conversion rate is 2.9%.
What counts as a "good" conversion rate? According to Ruler Analytics' analysis of over 100 million data points, the all-industry average sits at 2.9% (Blogging Wizard, 2026). But industry matters enormously. Food & Beverage tops benchmarks at around 8.98%, while complex B2B sectors like computer product manufacturing can sit as low as 1.1%. Professional services (5.0%), industrial (4.4%), and automotive (4.0%) consistently outperform the average for organic search traffic.
Why CRO Matters More Than Driving More Traffic
Here's a question most digital teams don't ask: what happens if you doubled your conversion rate instead of doubling your ad spend?
Paid traffic is expensive — and getting more expensive. Google Ads CPCs have climbed across most industries for five consecutive years. Meanwhile, a conversion rate improvement costs nothing in media spend; it extracts more value from visitors you're already paying to attract.
The math is stark. Say you spend $50,000/month on paid traffic and convert at 2%. That gives you 1,000 conversions. Increasing traffic 50% to get 1,500 conversions costs another $25,000/month. Increasing conversion rate 50% to 3% delivers the same 1,500 conversions — at zero additional ad cost.
That's why CRO adoption is accelerating. The CRO tools market is projected to reach $5.07 billion in 2025, up from $3.01 billion in 2019 (WordStream, 2026). HubSpot's 2026 State of Marketing Report found that CRO is the second-most-used optimization technique among marketers globally, trailing only audience segmentation — and by just one percentage point (HubSpot, 2026).
Yet despite this momentum, investment is uneven. More than half of companies spend below 5% of their marketing budget on CRO (ElectroIQ, 2026). Only 39.6% have a formally documented optimization strategy. That gap is an opportunity for every team willing to build a disciplined program.
According to a 2025 SQ Magazine analysis, companies using CRO tools report an average ROI of 223% — making it one of the most measurable and consistently high-return investments in a marketing stack. The 5% of firms that report no ROI from CRO almost universally share a common trait: they're running ad-hoc tests without a systematic process (SQ Magazine, 2025). Process, not magic, is what produces compounding results.
The Six Core Levers of Conversion Rate Optimization
CRO isn't a single tactic. It's a discipline with multiple levers — and the most successful practitioners pull several simultaneously. Here are the six fundamentals every CRO program should address.
1. A/B Testing and Experimentation
A/B testing is the backbone of every serious CRO program. You create two versions of a page element (a headline, a CTA button, a hero image, a form layout), split your traffic between them, and let user behavior decide which performs better. When done rigorously, it removes opinion from the equation.
A/B testing can yield up to a 49% increase in conversion rates, yet only 44% of companies use it regularly (ElectroIQ, 2026). The discipline matters as much as the tool: test one variable at a time, form a clear hypothesis before you start ("Changing CTA color from blue to green will increase clicks because green signals 'go'"), and run tests long enough to reach statistical significance.
Multivariate testing takes this further, simultaneously testing multiple combinations of elements. It's powerful on high-traffic pages where micro-optimizations compound quickly. For lower-traffic pages, stick to A/B — multivariate needs significant sample sizes to produce reliable results.
2. Page Speed and Technical Performance
Speed is not a UX nicety. It's a conversion variable. Sites loading in one second achieve approximately 3× the conversion rate of sites that take five seconds (Landbase, 2026). Walmart discovered a 2% conversion lift for every one-second improvement in load time. Amazon calculated that a 100ms delay could cost them 1% in annual sales.
A one-second delay in load time can reduce conversions by up to 7% (EverConnect, 2024). Start with Google PageSpeed Insights to identify your biggest bottlenecks — typically uncompressed images, render-blocking scripts, and missing browser caching — then prioritize fixes by traffic volume of the affected pages.
3. Mobile Experience Optimization
Mobile drives roughly 60% of web traffic, but desktop still converts at nearly twice the rate: desktop averages 4.8% versus mobile's 2.9% (Landbase, 2026). On mobile e-commerce, cart abandonment spikes to 85.65% compared to the already-painful all-device average of ~70% (SQ Magazine, 2025).
That gap is a massive opportunity. Most mobile conversion problems trace to a handful of root causes: checkout flows designed for desktop, tap targets too small for thumbs, forms with too many fields, and pages that take more than three seconds to load on 4G. Progressive Web Apps (PWAs) are one structural fix — brands that migrated to PWAs reported median mobile conversion rate improvements of 62% within 12 months (Amra & Elma, 2026).
4. Landing Page and Copy Optimization
Your landing page is where the conversion happens — or doesn't. The top 25% of landing pages convert at 5.31% or higher, while the bottom 25% rarely exceed 1% (SQ Magazine, 2025). What separates them isn't design flair; it's clarity of message, relevance to the visitor's intent, and removal of every unnecessary decision.
Key landing page principles that consistently move the needle:
Message match: the headline of your landing page should mirror the ad copy or search result that brought the visitor there. Disconnects kill conversions.
Single focus: every landing page should have one primary CTA. Multi-CTA pages scatter attention and reliably underperform.
Above-the-fold value prop: visitors decide within seconds whether they're in the right place. Lead with the outcome you deliver, not a description of your product.
Form friction: every additional form field reduces completion rates. Audit whether each field is truly necessary, or just nice-to-have for your CRM.
5. Social Proof and Trust Signals
People don't convert when they're uncertain. Social proof — reviews, testimonials, case studies, trust badges, customer logos — reduces that uncertainty by showing that others like them have taken the leap and benefited.
PowerReviews' research found that visitors who interact with customer reviews are 108.3% more likely to convert (Blogging Wizard, 2026). Interactions with Q&A sections lift conversions by 194.2%. Product image gallery interactions boost likelihood of purchase by 110.7%.
The placement matters as much as the presence. A testimonial buried on a dedicated "Reviews" page does far less work than a star rating displayed directly next to the "Add to Cart" button. Trust signals earn their keep when they're positioned at the exact moment of decision — not tucked away as an afterthought.
6. Personalization and Behavioral Targeting
Generic experiences are increasingly a conversion liability. Personalized CTAs outperform generic ones by approximately 42% (SQ Magazine, 2025). AI-powered personalization is now the leading CRO technique, adopted by 28.2% of marketers, followed by A/B testing at 24.1%.
Personalization ranges from simple (showing different headlines to new vs. returning visitors) to sophisticated (real-time product recommendations based on browse history). Start with segmentation: identify your two or three most distinct visitor personas and create tailored landing page variants for each. Measure lift against a generic control.
How to Build a CRO Process That Actually Compounds
Random testing doesn't build compounding growth. A repeatable process does. Here's the framework that disciplined CRO teams use to turn one-off wins into sustained improvement.
Step 1 — Diagnose with data. Before you test anything, understand your current funnel. Use Google Analytics (or equivalent) to identify where visitors drop off. Combine quantitative data (bounce rates, exit pages, funnel drop-off points) with qualitative tools (heatmaps, session recordings, user surveys) to understand why they're leaving. Heatmaps show where users click; scroll maps reveal how far they read; session recordings let you watch real friction moments unfold.
Step 2 — Prioritize high-impact opportunities. Not all tests are equal. Start on your highest-traffic, lowest-converting pages — homepage, main product pages, checkout, key landing pages. Use a scoring framework like PIE (Potential, Importance, Ease) to rank which tests to run first. One impactful test on a high-traffic page beats ten tests on pages nobody visits.
Step 3 — Form a hypothesis. Every test needs a specific, falsifiable hypothesis. "We believe changing the CTA from 'Learn More' to 'Get Your Free Audit' will increase form submissions by at least 10% because it communicates a concrete value exchange." Vague hypotheses produce ambiguous learnings; specific ones build institutional knowledge.
Step 4 — Run and measure rigorously. Run tests for at least one full business cycle (typically two to four weeks), resist the urge to call a winner early, and ensure you've reached statistical significance before drawing conclusions. Use tools like VWO, Optimizely, or Google Optimize to manage experiments and track results cleanly.
Step 5 — Document, learn, iterate. A test result — win or lose — is a learning. Document what you tested, what you hypothesized, what happened, and why you think it happened. This knowledge base compounds over time, helping your team avoid re-testing lost hypotheses and building on proven wins.
[UNIQUE INSIGHT: Most CRO programs fail not at the testing stage but at documentation — teams that keep rigorous test logs consistently outperform those that treat each test as a standalone event.]
69% of marketers now report using web analytics tools as their core CRO diagnostic layer, with 64% employing UX testing and 61% using personalization tools as part of their stack (SQ Magazine, 2025). The infrastructure is widely available — the differentiation comes from how systematically teams use it.
CRO vs SEO: How They Work Together
People sometimes treat CRO and SEO as competing priorities. They're not — they're multiplicative.
SEO drives traffic. CRO converts it. You need both, but the order of operations matters. Optimizing your conversion rate first means every incremental visitor SEO delivers is more valuable. Increase traffic without fixing conversion and you scale waste.
There's also a subtler connection: Google measures user behavior signals — dwell time, bounce rate, pages per session — as quality indicators. A page that converts well tends to be one users engage with, which reinforces organic rankings. Fast-loading, mobile-optimized, relevant pages win on both dimensions.
The channels also differ in conversion performance. Email remains the strongest conversion channel at an estimated 15.22% average conversion rate, more than five times the all-industry average (Landbase, 2026). Paid search converts at around 3.2%, above the organic average of 2.7% across all industries. Social media lags significantly. Understanding channel-level conversion performance helps you allocate budget and set realistic targets by source.
What Does the Future of CRO Look Like?
CRO in 2026 is being reshaped by two forces: AI personalization and accessibility standards.
AI-driven personalization has moved from experimental to mainstream. Brands using AI-powered funnel personalization have pushed average conversion rates to 6.8%, with top performers exceeding 14.3% — a full three-point jump in a single year (Amra & Elma, 2026). The mechanism is real-time behavioral targeting: showing different content, offers, and CTAs to different users based on predicted intent.
On the accessibility front, the EU Accessibility Act's June 2025 enforcement deadline created a measurable business impact. Fully WCAG 2.2 AA-compliant websites now average a 19.3% higher conversion rate than non-compliant peers, with accessible checkout flows showing the largest gains at 24.7% higher completion rates (Amra & Elma, 2026). Accessible design isn't just an ethical win — it's a conversion win, because it improves navigation and readability for all users, not only those with disabilities.
Citation Capsule: According to the Web Accessibility Initiative's 2026 Global Conversion & Compliance Study, brands that proactively implemented WCAG 2.2 accessibility improvements in Q1 2025 reported a cumulative 11.2% revenue uplift by Q1 2026, compared to those that waited for regulatory enforcement (Amra & Elma, 2026). Accessibility is no longer a compliance cost — it's a conversion lever.
CRO Tools Worth Knowing in 2026
You don't need every tool — you need the right tool for your current stage. Here's a quick orientation:
Analytics and funnel diagnosis: Google Analytics 4, Heap, Amplitude. These tell you where people drop off. Start here before buying anything else.
Behavioral analysis: Hotjar, Microsoft Clarity (free), FullStory. Heatmaps, session recordings, and scroll maps that explain why people drop off.
A/B and multivariate testing: VWO, Optimizely, AB Tasty, Google Optimize. Pick one and use it consistently — consistency matters more than the specific platform.
Personalization: Dynamic Yield, Mutiny (B2B), Personyze. These require meaningful traffic volumes and clean data pipelines to produce reliable results.
Landing page builders: Unbounce, Instapage, Leadpages. Faster iteration cycles than engineering-dependent page updates.
The global CRO tools market is projected to reach $5.07 billion in 2026 (WordStream, 2026), reflecting both the scale of adoption and the confidence businesses have in CRO ROI.
Frequently Asked Questions
What is conversion rate optimization in simple terms?
CRO is the practice of improving your website so more visitors take the action you want — whether that's buying, signing up, or calling. Instead of spending more to attract traffic, you focus on converting the traffic you already have. Companies using CRO tools report an average ROI of 223% (SQ Magazine, 2025), making it one of the highest-return investments in digital marketing.
What is a good conversion rate to aim for?
The all-industry average is approximately 2.9%, but the top 25% of landing pages achieve 5.31% or higher (SQ Magazine, 2025). Your target should be benchmarked against your specific industry and channel — professional services averages 5.0%, B2B ecommerce can sit below 1.5%. Beating your own historical performance matters more than matching a generic benchmark.
How long does it take to see CRO results?
Simple A/B tests on high-traffic pages can produce statistically significant results in two to four weeks. Structural changes — mobile checkout redesigns, full landing page overhauls — take longer to implement and validate. Most teams see meaningful compounding improvement over three to six months of disciplined testing, not overnight.
What's the difference between CRO and UX design?
UX design focuses on the overall usability and experience of a product. CRO focuses specifically on improving conversion metrics through data-driven experimentation. They overlap significantly — better UX often drives better conversions — but CRO is more narrow in scope and more measurement-oriented. A UX designer improves how something feels; a CRO practitioner measures whether that improvement changes behavior and revenue.
Is CRO only for e-commerce?
No. CRO applies to any website with a conversion goal: SaaS demo requests, B2B lead forms, nonprofit donation pages, media subscription signups, appointment bookings. The tactics shift depending on the goal and funnel complexity, but the underlying process — diagnose, hypothesize, test, learn — applies universally.
Conclusion
Conversion rate optimization is the discipline of making your existing traffic more valuable — and in an environment where paid acquisition costs keep climbing, that makes it one of the most important capabilities a digital team can build.
The fundamentals don't change: understand your users, identify friction, form hypotheses, test rigorously, and document every learning. Layer in modern tools — behavioral analytics, AI personalization, mobile-optimized checkout flows — and those fundamentals compound.
The gap between teams that do this systematically and those that don't is widening. Only 39.6% of companies have a documented CRO strategy. The top 25% of landing pages are converting at more than twice the industry average. Those aren't outliers — they're the result of process.
Start with your highest-traffic, lowest-converting page. Pick one hypothesis. Run one clean test. That's the first iteration.
Sources: SQ Magazine (2025), Landbase (2026), Blogging Wizard / Ruler Analytics (2026), WordStream (2026), HubSpot State of Marketing (2026), ElectroIQ (2026), Amra & Elma (2026), EverConnect (2024)